How to track projects with the Dashboard of MyTaskPanel
Do you handle different projects on a daily basis? Today we will tell you about our general Dashboard and our particular dashboards for each project, two fundamental tools to know how to track projects in the best way.
General Dashboard
If you are the manager or administrator of your company’s projects, you will have access to the general Dashboard of MyTaskPanel to consult all the accounts and projects created, and obtain a global vision of the company.
This dashboard displays active projects and accounts, to which you can assign different colors in order to quickly identify which ones correspond to each category. The objective of these graphs and analytics is to know at a glance what status each project of the company is in.
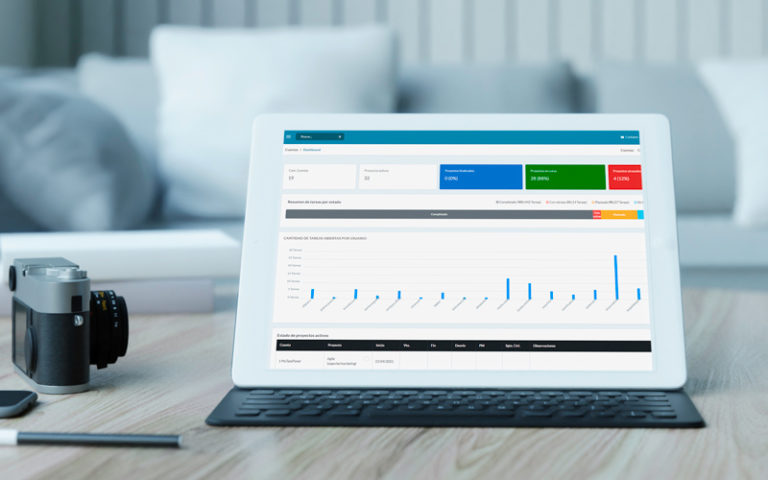
What can you find in this general Dashboard?
- The percentages of completed, ongoing, and overdue projects at the top of the dashboard.
- The summary of tasks by status, also with percentages.
- The number of open tasks assigned to each user.
- A table with a row for each project, with the following indicators that you can review or complete, depending on the case: which account it belongs to, start, expiration and end date, deviation due to delay, if any, name of the project manager , date of control and observations (a summary of the situation of the project).
- A worksheet with all the workers and projects in which they record hours through MyTaskPanel. It can be viewed by month or by week.
Particular dashboard of a project
Within each project, in addition to the task board, the calendar and the timeline, you have the possibility of observing the metrics of that particular project, through a Dashboard. Its main objective is to show you how the project is in relation to the total level of progress.
What can you find in this particular Dashboard?
- A dashboard with summarised information about the entire project.
- The percentages with the start, closure and end dates, with colors that vary according to the time remaining for the project to be completed and the deviation in case there was a delay, in addition to the percentages of the completed tasks.
- A summary of all tasks with percentages by state.
- Charts to see the tasks for each group or column. It is modified according to the groups you use and how many tasks you have within each one.
- A graph of the status of the tasks, to be viewed by choosing different filters.
- The assigned and unassigned tasks in another chart.
- A graph with the number of tasks for each label.
- The productivity of the members of the projects through another graph; that is, the professionals who have closed the most story points in the period of time you are consulting.
- Several filters to observe the tasks by iterations, groups, labels and other indicators, in a combined way.
In short, MyTaskPanel offers you the analysis you need, through the Dashboards. Knowing how to track projects is now much easier. Try it for free and get control of every single detail.